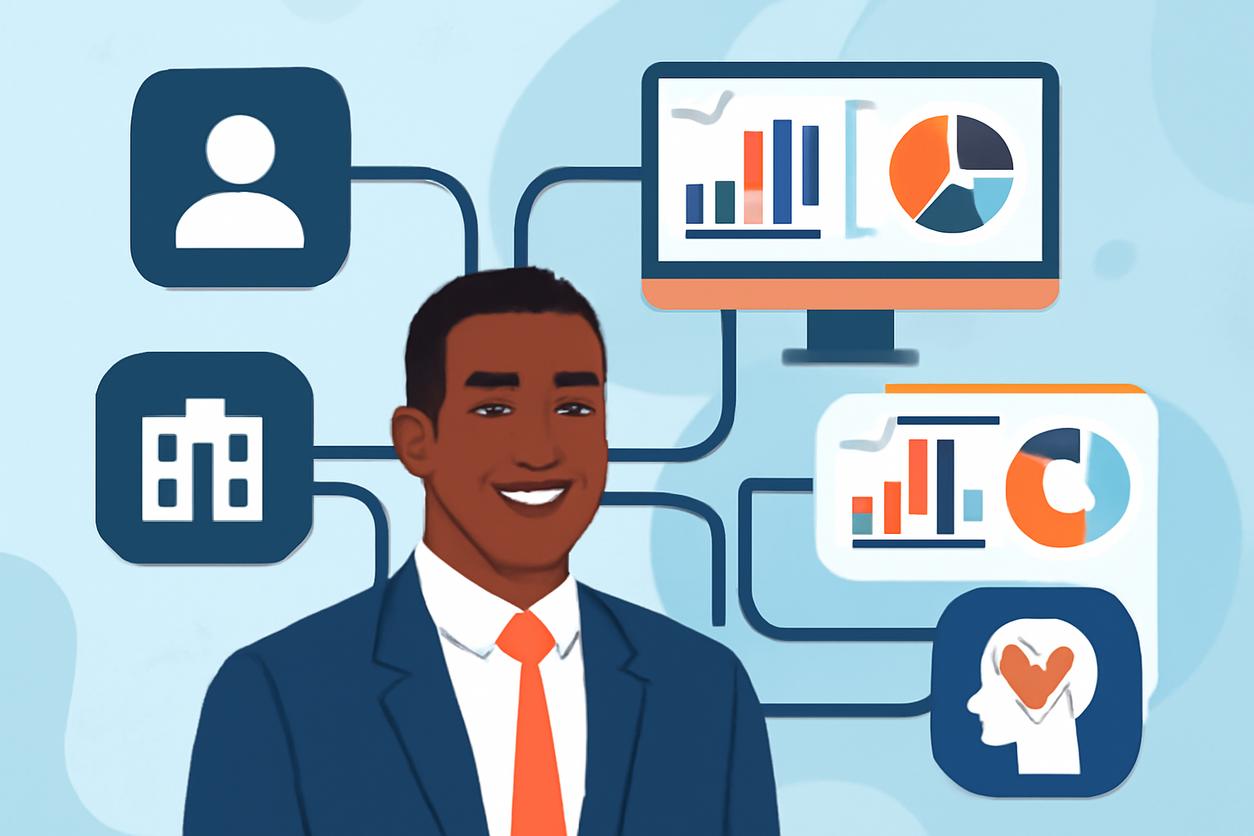
A Practical Guide to People Analytics: Driving Business Outcomes with Data
Welcome to your tactical playbook for leveraging People Analytics. This guide is designed for HR leaders, people operations professionals, and data-driven managers who want to move beyond traditional HR metrics and use data to make strategic decisions that impact the bottom line. We will explore how to connect workforce data to tangible business outcomes, providing a clear roadmap from data collection to impactful action.
Table of Contents
- Executive Summary
- Why People Analytics Matters Now
- Which Workforce Signals Predict Performance and Retention
- Data Sources, Integration and Architecture Basics
- Analytical Approaches and Tool Selection
- Ethics, Privacy and Governance for People Data
- Building a Phased Implementation Roadmap
- Anonymized Case Examples and Lessons Learned
- Practical Templates and Decision Checklists
- Measuring Impact and Continuous Improvement
- Appendix: Glossary and Further Reading
Executive Summary
People Analytics, also known as HR analytics or workforce analytics, is the practice of collecting and analyzing organizational, people, and talent data to inform business decisions and improve performance. It transforms HR from an administrative function into a strategic partner that can directly influence profitability, innovation, and growth. This guide provides a step-by-step framework for building a robust people analytics function. We will cover how to identify predictive metrics for retention and performance, establish a solid data infrastructure, select the right tools, and navigate ethical considerations. Through anonymized case studies, practical templates, and actionable checklists, you will learn how to launch and scale a program that demonstrates clear return on investment (ROI) and drives continuous improvement.
Why People Analytics Matters Now
In today’s competitive landscape, the most successful organizations are those that understand their most valuable asset: their people. The rise of hybrid work models, a persistent skills gap, and heightened employee expectations have made understanding the workforce more critical than ever. Intuition and anecdotal evidence are no longer sufficient for making high-stakes talent decisions. People analytics provides the evidence-based foundation needed to answer crucial business questions:
- What are the key drivers of employee turnover in our organization?
- Which leadership behaviors correlate with the highest team performance?
- Are our diversity, equity, and inclusion (DEI) initiatives actually moving the needle?
- What is the ROI of our learning and development programs?
By answering these questions with data, organizations can proactively manage talent, optimize processes, and create a more engaging and productive work environment. A mature people analytics capability is no longer a luxury; it is a competitive necessity for strategic workforce planning and sustainable success.
Which Workforce Signals Predict Performance and Retention
The core of effective people analytics lies in identifying the right signals. It’s about moving beyond lagging indicators (like turnover rate) to focus on the leading indicators that predict future outcomes. These signals provide an early warning system, allowing you to intervene before it’s too late.
Signals Predicting Employee Retention
- Manager Effectiveness: Data from 360-degree feedback and pulse surveys consistently shows that the quality of an employee’s direct manager is a top predictor of their intent to stay.
- Internal Mobility: A high rate of internal promotions and lateral moves indicates a culture of growth and opportunity. Low mobility can be a precursor to attrition among ambitious employees.
- Engagement Survey Trends: Look beyond the overall score. A decline in scores related to career development, recognition, or work-life balance for a specific department can signal a retention risk.
- Compensation Equity: Analyzing compensation data relative to market rates and internal peers is crucial. Perceived inequity is a powerful driver of turnover.
- Onboarding Experience: Data from new hire surveys can predict long-term success. A poor onboarding experience is strongly correlated with first-year attrition.
Signals Predicting Employee Performance
- Quality of Goal Setting: Analyzing data from your performance management system can reveal if well-defined, ambitious goals (like OKRs) correlate with higher achievement.
- Collaboration Network Strength: Using anonymized metadata from collaboration tools, you can identify employees who are key connectors and information hubs. These individuals are often high-performers, but also pose a risk if they leave.
- Skill Development Velocity: Tracking the rate at which employees acquire and apply new skills (via an LMS or skills-mapping platform) is a leading indicator of future performance and adaptability.
- Peer Recognition Frequency: Data from recognition platforms can highlight individuals who consistently exhibit desired behaviors and contribute positively to team culture, often correlating with strong performance reviews.
Data Sources, Integration and Architecture Basics
A successful people analytics strategy depends on clean, integrated data. Your organization already possesses a wealth of information across various systems. The key is to bring it together.
Common Data Sources
- Human Resource Information System (HRIS): The foundation, containing core demographic data, tenure, role, compensation, and reporting structures.
- Applicant Tracking System (ATS): Provides rich data on recruiting channels, time-to-hire, quality-of-hire, and candidate experience.
- Performance Management System: Houses data on goal attainment, manager ratings, and peer feedback.
- Learning Management System (LMS): Contains information on course completions, skill certifications, and training effectiveness.
- Engagement and Survey Platforms: Critical for capturing employee sentiment, eNPS, and feedback on specific initiatives.
Integration and Architecture
Initially, you can start by manually exporting and combining data in spreadsheets. However, to scale, you’ll need a more robust solution. A common approach involves creating a central data warehouse or a data lake where data from different systems can be stored and connected. Using an ETL (Extract, Transform, Load) process, data is cleaned and standardized, ensuring you are analyzing “one source of truth.” This foundational work is critical for building trustworthy and reliable analytical models.
Analytical Approaches and Tool Selection
The journey of people analytics typically follows a maturity curve, with each stage providing deeper insights.
The Four Types of Analytics
- Descriptive Analytics: What happened? This is the most basic level, involving standard reports like headcount, turnover rate, and diversity metrics.
- Diagnostic Analytics: Why did it happen? This involves drilling down to understand the root causes. For example, why did turnover spike in Q3? You might find it was driven by a single department.
- Predictive Analytics: What will likely happen? This uses statistical models to forecast future outcomes, such as identifying employees at high risk of resigning in the next six months.
- Prescriptive Analytics: What should we do about it? This is the most advanced stage, recommending specific actions to take, such as a targeted intervention for an at-risk employee group.
Selecting the Right Tools
The tool you choose depends on your budget, team skills, and analytical maturity.
- Spreadsheets (e.g., Excel, Google Sheets): Perfect for starting out. They are ideal for basic descriptive analytics and for teams with limited budgets.
- Business Intelligence (BI) Platforms (e.g., Tableau, Power BI): Excellent for creating interactive dashboards and performing diagnostic analytics. They connect to multiple data sources and allow for deeper exploration.
- Specialized People Analytics Platforms: These solutions are built specifically for HR data, often with pre-built models for prediction and easy-to-use interfaces for HR professionals.
- Statistical Software (e.g., R, Python): For advanced predictive and prescriptive modeling, data scientists on your team can use these powerful open-source tools.
Ethics, Privacy and Governance for People Data
Trust is the currency of people analytics. Employees must be confident that their data is being used responsibly and ethically. A robust governance framework is non-negotiable.
Core Principles for Ethical Practice
- Transparency: Be open with employees about what data is being collected, for what purpose, and how it will be used to improve the organization and their experience.
- Anonymization and Aggregation: As a rule, analysis should be performed on aggregated and anonymized data to protect individual privacy. Only report on groups large enough to prevent individuals from being identified (e.g., groups of five or more).
- Purpose Limitation: Only collect and analyze data to answer specific, legitimate business questions. Avoid “data fishing” expeditions that could lead to biased or unfair conclusions.
- Security: Implement strict access controls and security protocols to protect sensitive employee data from breaches.
Establishing a data governance council with representatives from HR, Legal, IT, and business leadership is a best practice. This group can create policies, review projects for ethical implications, and ensure compliance with regulations like GDPR. For more guidance, consult expert resources on data ethics.
Building a Phased Implementation Roadmap
Implementing people analytics is a journey, not a destination. A phased approach ensures you build momentum, demonstrate value early, and scale sustainably.
| Phase | Timeline | Key Activities | Primary Goal |
|---|---|---|---|
| Phase 1: Foundational | 3-6 Months | Focus on one critical business problem (e.g., turnover in a key role). Consolidate 2-3 core data sources (e.g., HRIS, Exit Surveys). Build a basic descriptive dashboard. | Deliver a quick win and demonstrate the value of data. |
| Phase 2: Expansion | 6-18 Months | Integrate more data sources (e.g., engagement, performance). Introduce diagnostic analytics. Train HR Business Partners to use dashboards. Automate reporting. | Embed data into regular HR processes and decision-making. |
| Phase 3: Strategic Maturity | 18+ Months (for 2025+) | Develop predictive models (e.g., attrition risk). Launch a dedicated people analytics team. Explore advanced techniques like Organizational Network Analysis (ONA). | Transform HR into a proactive, strategic, and predictive function. |
Anonymized Case Examples and Lessons Learned
Case Example 1: Reducing High-Performer Attrition
A fast-growing technology company was struggling with the loss of top engineering talent. The Approach: The people analytics team integrated data from their HRIS, performance management system, and engagement surveys. Their diagnostic analysis revealed that high-performers who had not been promoted within 18 months and who scored low on “career development opportunities” in surveys had an 80% probability of leaving within the next six months. The Action: HR Business Partners used this insight to initiate proactive career pathing conversations with at-risk, high-performing engineers. The Result: The company reduced high-performer attrition in the engineering department by 25% within a year, saving millions in recruiting and lost productivity.
Case Example 2: Improving Sales Team Effectiveness
A retail organization noticed that sales performance varied significantly across its stores. The Approach: The team analyzed data from the LMS, sales system, and employee feedback. They found that store managers who completed a specific advanced leadership training program led teams that consistently exceeded sales targets by 15%. They also discovered a correlation between high product knowledge scores and sales conversion rates. The Action: The company made the advanced leadership training mandatory for all store managers and rolled out a new micro-learning module for product knowledge. The Result: Overall company sales increased by 4% in the following year, directly attributable to these data-informed initiatives.
Practical Templates and Decision Checklists
Use these tools to bring structure to your people analytics projects.
Project Scoping Template
| Element | Description |
|---|---|
| Business Question | What specific, measurable question are we trying to answer? (e.g., “What is the primary driver of voluntary turnover among our customer service representatives?”) |
| Hypothesis | What is our initial assumption? (e.g., “We believe turnover is driven by a lack of career growth.”) |
| Required Metrics | What data points do we need to test this? (e.g., Voluntary turnover rate, promotion rate, engagement scores on career development.) |
| Data Sources | Which systems hold this data? (e.g., HRIS, Engagement Platform.) |
| Stakeholders | Who needs to be involved and informed? (e.g., Head of Customer Service, HRBP, Data Analyst.) |
| Success Criteria | How will we know we’ve succeeded? (e.g., “Identify the top two drivers and propose two actionable interventions.”) |
Analytics Tool Selection Checklist
- Integration Capabilities: Can it easily connect to our key data sources (HRIS, ATS, etc.)?
- Security and Compliance: Does it meet our security standards and comply with data privacy regulations (e.g., GDPR)?
- Scalability: Can the tool grow with us as our data volume and analytical complexity increase?
- User Experience: Is it intuitive for non-technical users like HR Business Partners and managers?
- Customization: Can we build custom reports and dashboards that align with our unique business metrics?
- Support and Training: What level of support and training resources does the vendor provide?
Measuring Impact and Continuous Improvement
To secure ongoing investment and support for people analytics, you must demonstrate its value in business terms. The most effective way to do this is by calculating the ROI of your interventions.
ROI Formula Example:
Imagine a project to reduce turnover costs.
- Calculate the Cost of Turnover: (Cost of recruiting + cost of onboarding + lost productivity) x (number of departing employees). Let’s say this is $500,000.
- Calculate the Cost of the Intervention: The cost of a new manager training program informed by your analysis is $50,000.
- Measure the Benefit: The program reduces turnover by 20%, resulting in a savings of $100,000 (20% of $500,000).
- Calculate ROI: (($100,000 Savings – $50,000 Cost) / $50,000 Cost) x 100 = 100% ROI.
Beyond ROI, establish a continuous improvement loop. Share your findings widely, gather feedback from leaders on the utility of the insights, and constantly refine your analytical models as new data becomes available. This iterative process ensures your people analytics function remains relevant, credible, and impactful.
Appendix: Glossary and Further Reading
Glossary
- HRIS (Human Resource Information System): A software solution that maintains, manages, and processes detailed employee information and HR-related policies and procedures.
- Lagging Indicator: A metric that measures a past outcome (e.g., employee turnover rate for the last quarter).
- Leading Indicator: A predictive metric that can forecast future outcomes (e.g., declining engagement scores, which may predict future turnover).
- Predictive Analytics: The use of data, statistical algorithms, and machine learning techniques to identify the likelihood of future outcomes based on historical data.
- Organizational Network Analysis (ONA): A method for visualizing and analyzing how communications, information, and decisions flow through an organization.
Further Reading
- General Overview: For a foundational understanding of the field, the Wikipedia page on People Analytics provides a comprehensive summary.
- Practical Guidance: The Chartered Institute of Personnel and Development (CIPD) offers excellent resources and guidance on implementing HR analytics.
- Ethics and Governance: For deep insights into the responsible use of data, refer to the OECD’s framework on data ethics.